
 The association between income and wealth is surprisingly complex and not well-understood. Yet this relationship is central to many of the questions that scholars of work, occupations, and inequality study.
The two are related but conceptually distinct: income is the flow of financial resources into a household from wages and salaries, investment returns, government transfer payments, and other sources. By contrast, wealth is a household’s total saved resources and is usually measured as net worth (total assets less total debts).
Both income and wealth are important measures of household financial well-being, the benefits a household receives from paid labor, and inequality across households. Not surprisingly, academics have rightfully studied both measures extensively; however, the association between income and wealth—beyond what each measure tells us on its own—holds additional and critical information that has attracted very little attention.
At first, the relationship between income and wealth may seem simple: as income increases, so too should wealth. Indeed, many assume that these indicators are strongly and positively correlated. In reality, the correlation between income and wealth is positive but relatively low, and there is no single, simple explanation for what happens to wealth when income rises.
Income and wealth are positively but lowly correlated
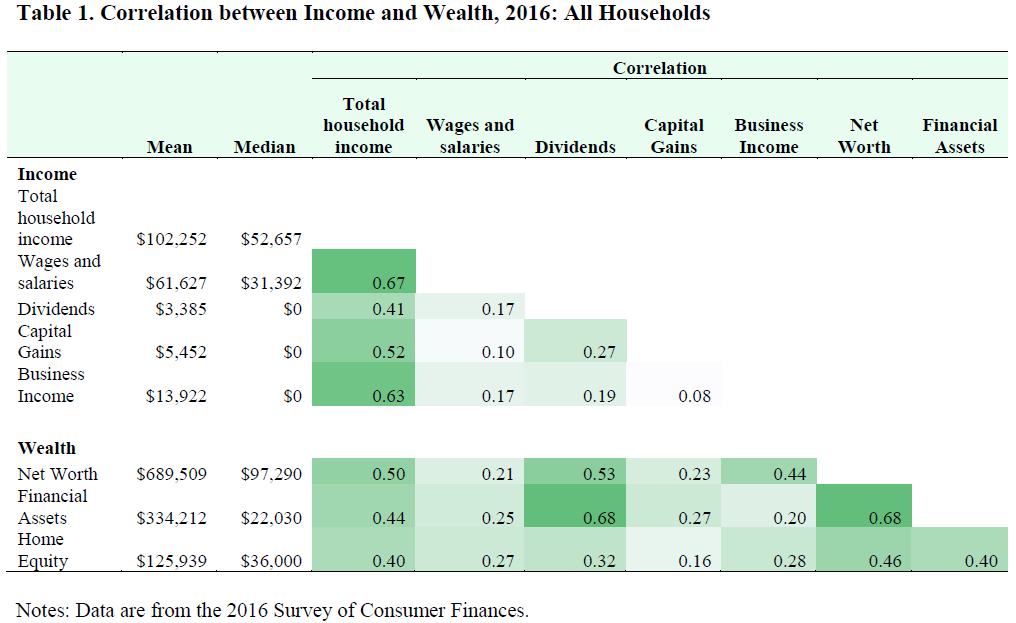
The correlation between total household income and total net worth among US households is .50 and varies depending on the definition used (Table 1).
Part of the explanation for the relatively low correlation is behavioral. Some households have high income from current work but low saving rates and, as a result, low wealth. For instance, some top executives, surgeons, and professional athletes have high salaries but high spending rates that prevent them from accumulating assets.
At the other extreme are households with high net worth but low income; for example, a person who inherited high wealth or a retiree who saved consistently over the working years may have high levels of assets but low income from current work.
The correlation is further complicated by the fact that both income and wealth are made up of various components that behave differently and are correlated differently with each other. For example, those with high wealth may receive income from work as well as from interest, dividends, businesses, and other sources; whereas those with low wealth are unlikely to have income from these non-work sources.
The incomplete overlap between income and wealth
Table 1 shows how the various components of income and wealth are distributed differently across households and how they are related to each other. The differences between mean and median income and wealth sources underscores the degree to which these resources—particularly the wealth measures—are unequally distributed across households.
The Table also shows that the correlations between the various components of income and wealth range from .16 to .68. The table highlights some important relationships. For instance, the correlation between wage/salary income and net worth is .21. That means that when we remove investment-derived income (e.g., interest, dividends) from the calculation, the correlation between income and wealth drops further.
The relatively low correlation between income and wealth also reflects important differences between the typical household and those with high incomes and wealth.
Table 2 provides correlations that exclude those in the top one percent by income and wealth. It shows that the correlation between income and wealth increases when we exclude those not in the top of the income and wealth distributions.
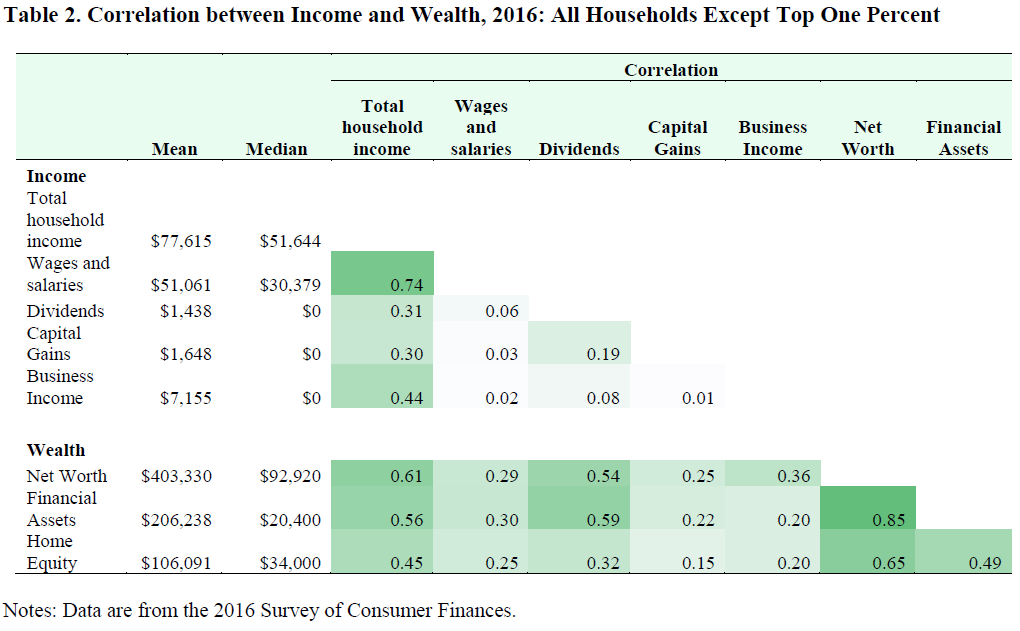
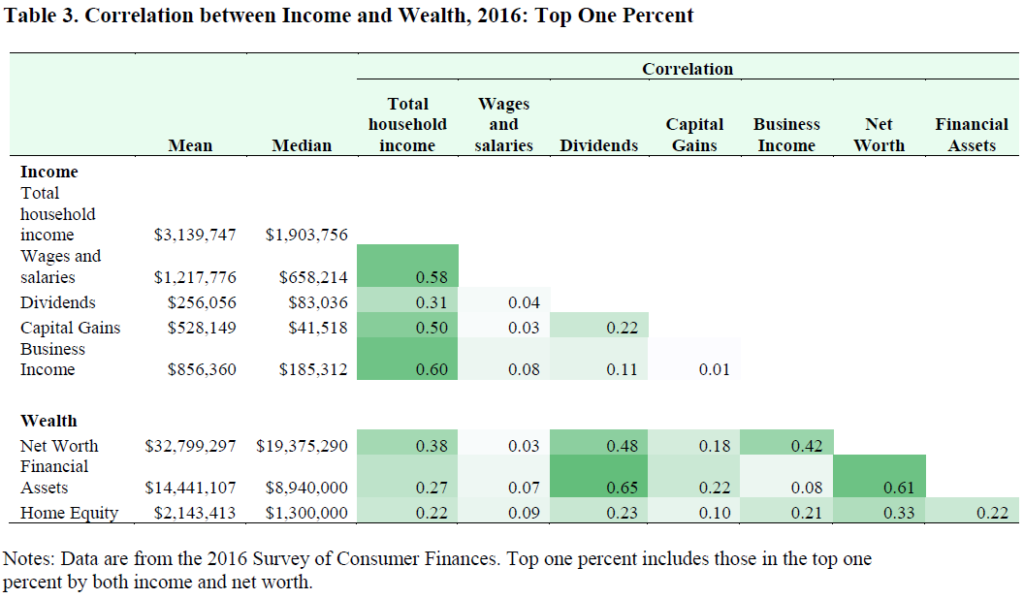
Table 3 shows the same correlations for those who are in both the top one percent by income and the top one percent by wealth. It underscores how different the top one percent are from other households. For example, wage and salary income are correlated at .03 with net worth for these households.
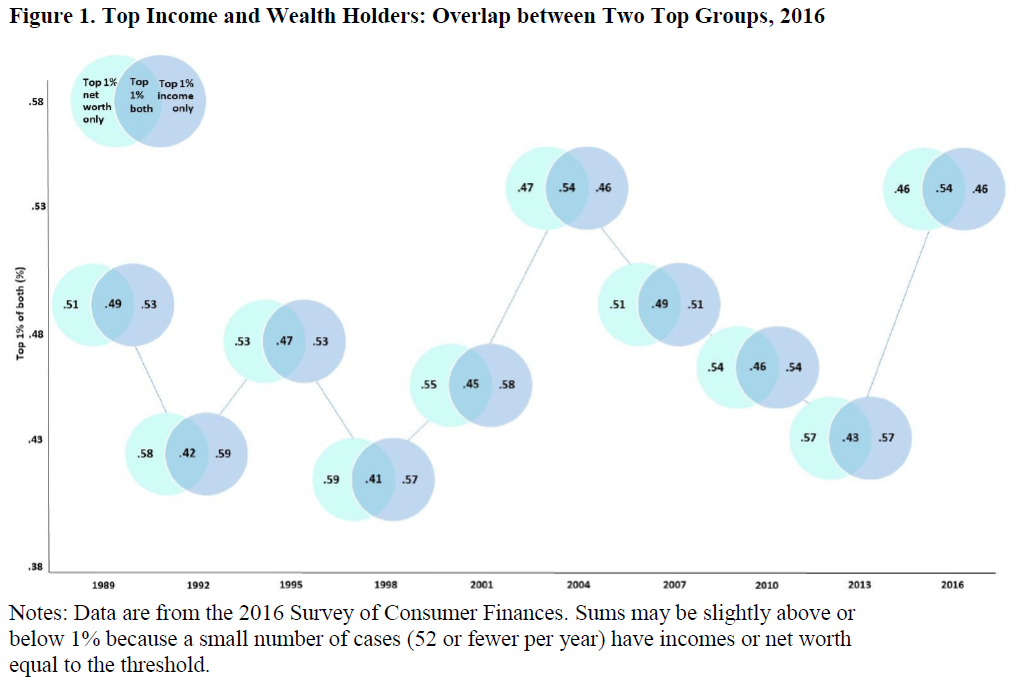
In a paper with Hang Young Lee, I explored the relationship between income and wealth for wealthy households in more detail. Figure 1 updates findings from that paper; it depicts two overlapping circles, one representing the top one percent by income and the other representing the top one percent by net worth.
1% by income is not equivalent to 1% by wealth
For each year included in Figure 1, (a) the sum of those in the top one percent by income and those in the top one percent of both distributions equals 1% (i.e., the one percent of the income distribution); and (b) the sum of those in the top one percent by net worth and those in the top one percent of both distributions equals 1% (i.e., the one percent of the net worth distribution). In 2007, for example, .51% of households are in the top one percent by income only, .51% are in the top one percent by net worth only, and .49% are in the top one percent of both distributions.
The Figure shows that about half of households in either the top 1% of income earners or the top 1% of net wealth owners are in the top of both distributions in any year. That is, there are always some households who are at the top of one distribution and not at the top of the other.
The incomplete overlap of the tops of the two distributions underscores the complexity of the relationship between income and wealth and suggests that there are multiple combinations of income and wealth that can contribute to membership in top positions. If income and wealth were more highly correlated, there would be more households in the overlapping group that is at the top of both distributions.
One scenario that would lead to membership in the top of both distributions involves having very high earned income. A high salary alone can lead to membership in the top one percent of the income distribution, but a high salary is often accompanied by asset-related compensation, such as stock options, that can lead to high net worth. Moreover, asset-related compensation can feed back into income through investment earnings, adding even more to both income and net worth. Similarly, very high net worth typically produces high levels of income, which, if accompanied by additional earned income, can lead to high values on both resources.
The correlation as an indicator of inequality
So what difference does this make?
The association between income and wealth matters for many of the processes that lead to financial well-being and inequality. It is an important indicator of financial security because it demonstrates whether a household is able to turn income into savings rather than spending it whether on necessities or luxuries. It is an indicator of inequality, and this becomes clear in the differences between the top of the income and wealth distributions and other households shown across Tables 1 through 3.
If we were to look more closely at how the relationship between income and wealth varies by occupation, it could indicate which industries and occupations receive the most benefits now and is suggestive of which may receive benefits in the future.
Important policy implications also follow from variations in the correlation between income and wealth. For example, in addition to focusing need-based assistance on households that have low income or low wealth, it might also be useful to explore whether their ability to turn income into wealth is an indicator of need for some households.
No Comments